Generate Graphs
You can make your own attribution graph from a prompt. It takes about a minute.
Supported Models
| Model | Notes |
|---|---|
| Gemma 2 2B | Select Gemma Scope transcoders, or cross-layer transcoders (CLT). |
| Gemma 3 4B Instruct | Chat messages. |
| Qwen3 4B | Chat messages, with optional thinking text. |
| Qwen3 1.7B | Attention tracing with LORSA. See Attention & LORSA. |
Each model can have more than one Source Set (a set of transcoders). Select it in the form. Other models on the circuit tracer have graphs that you can explore, but you cannot generate new graphs for them.
Steps
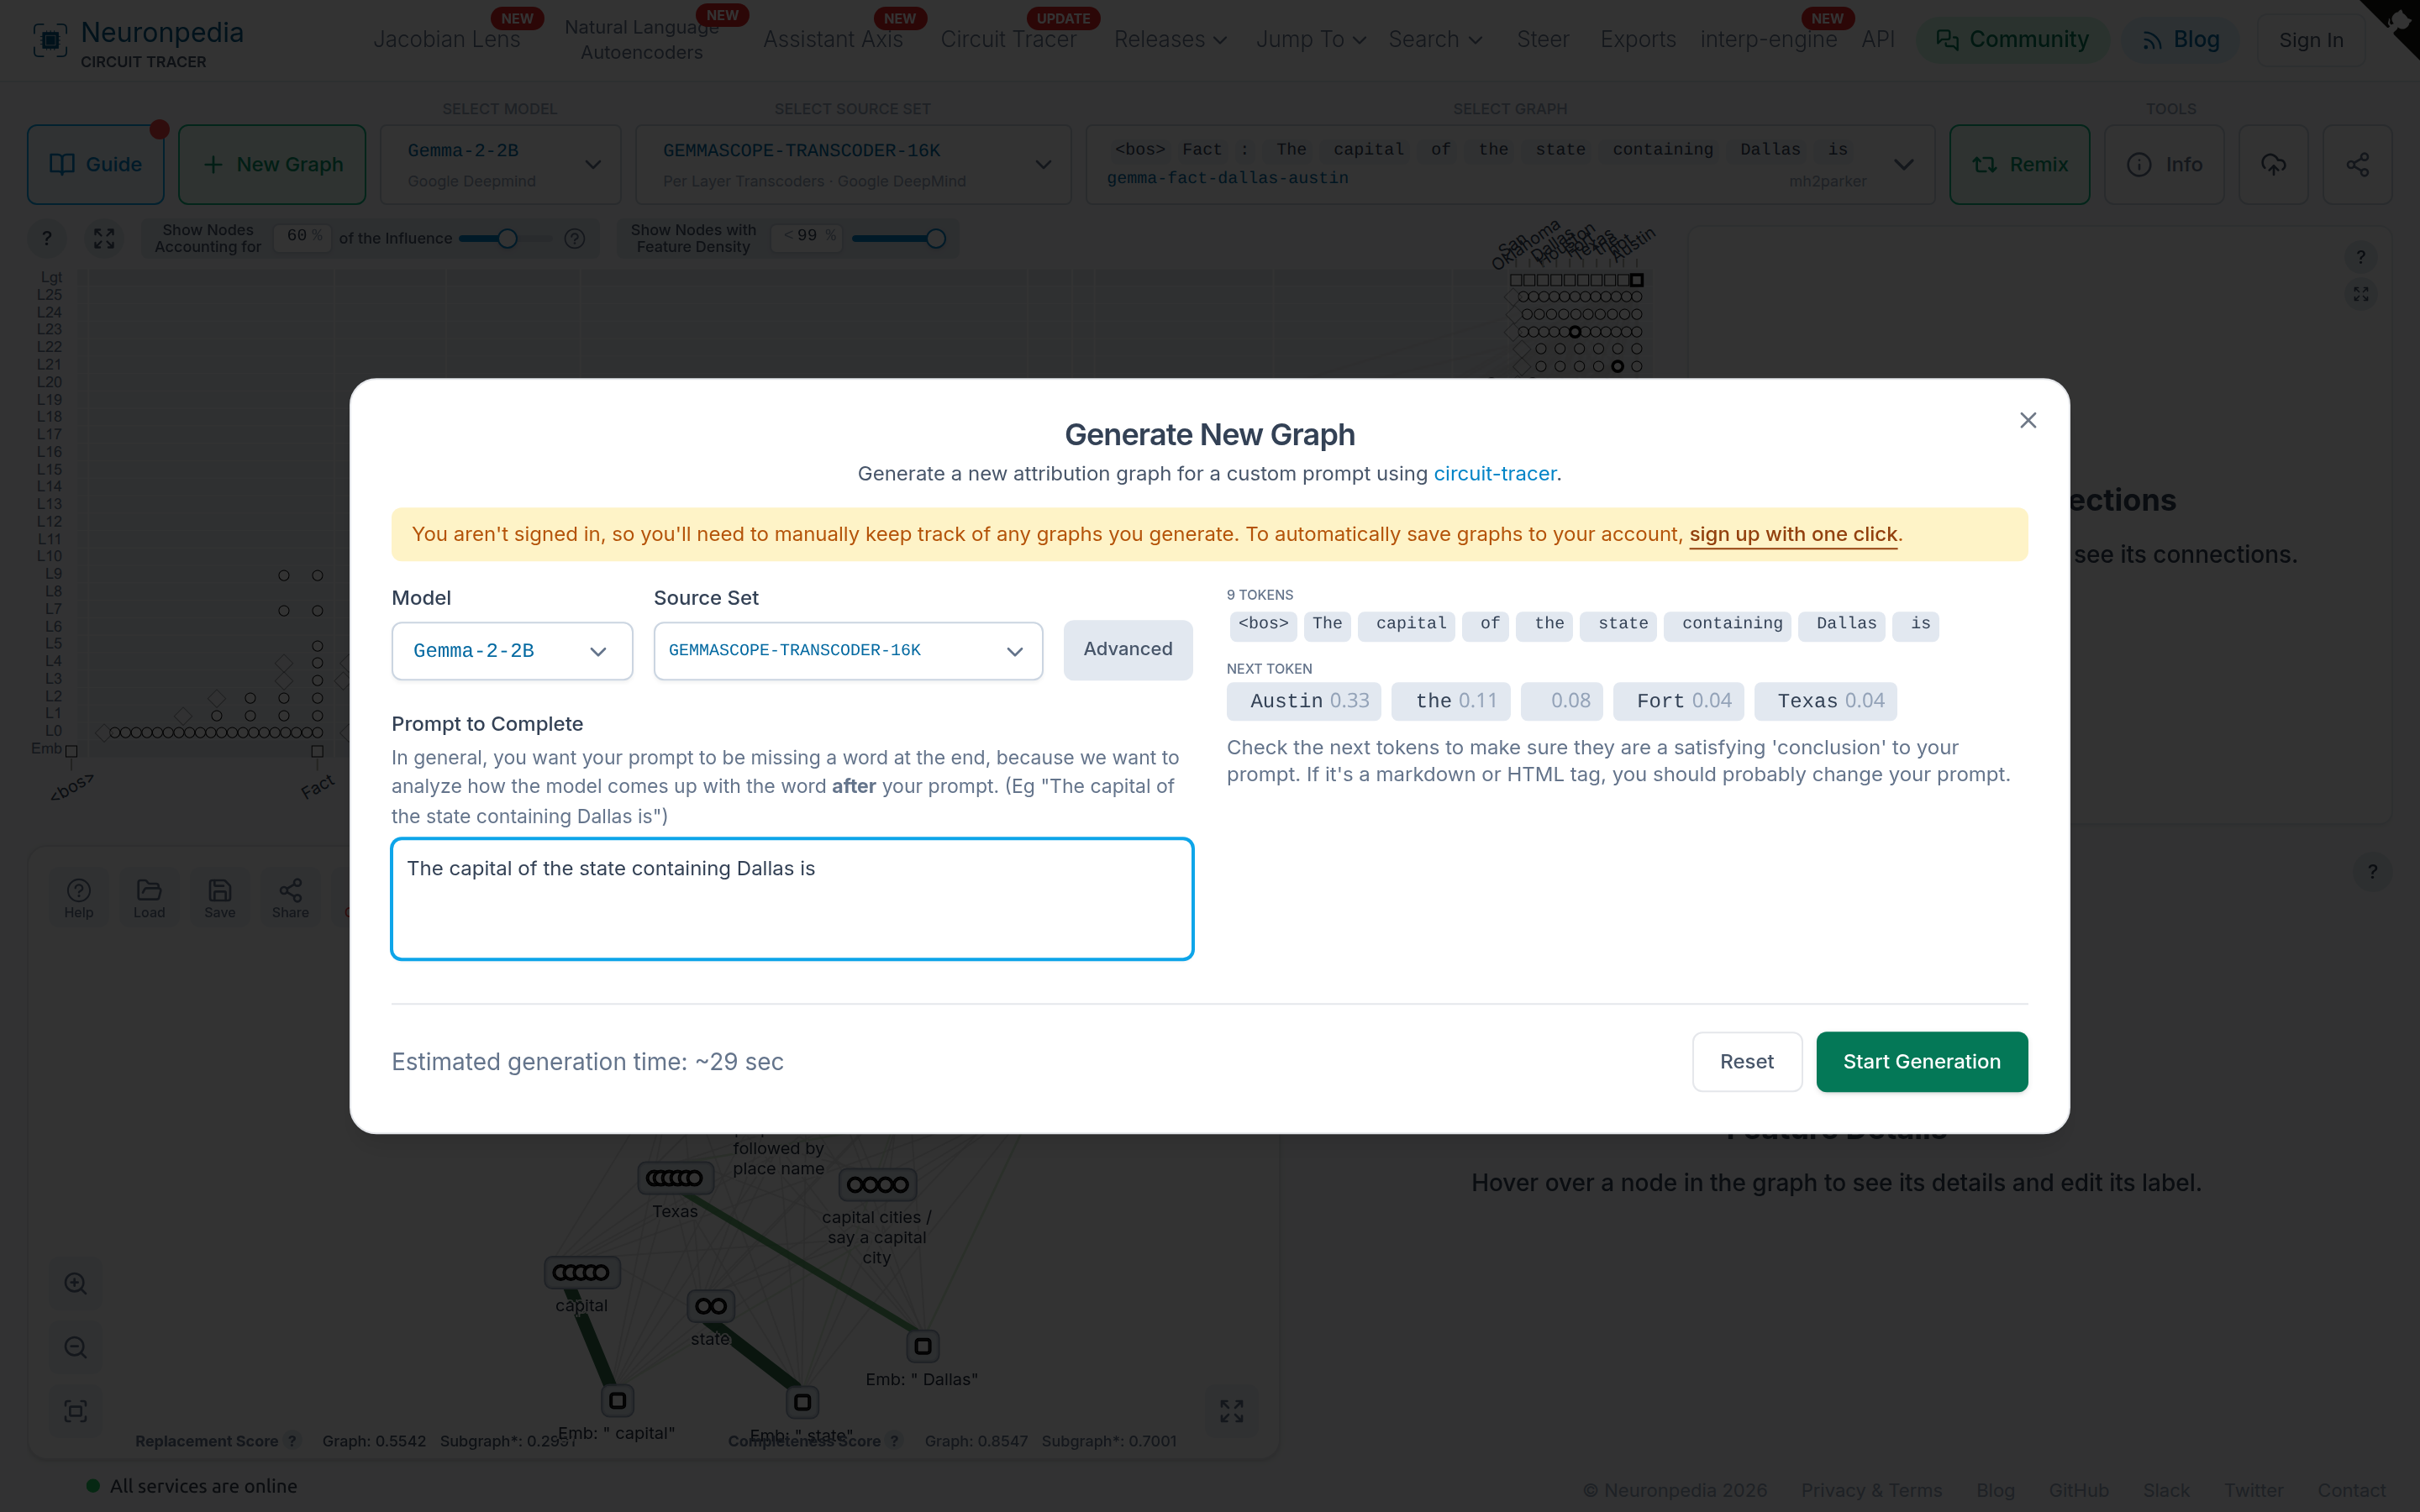
- Go to the circuit tracer, then click + New Graph at the top left.
- Select a Model and a Source Set.
- Type your prompt.
- For a base model, type your text in Prompt to Complete.
- For an instruct model, click + User, + System, or + Model to add chat messages.
- Look at the tokens and the Next Token list under the prompt. These are the tokens that the model will most likely output next. Make sure that the top token is the answer that you want to explain.
- Click Start Generation. When it is done, click the link to open your graph.
Write a Good Prompt
The graph explains how the model predicts the next token after your prompt. So your prompt should stop just before an interesting word.
- ✅ Good:
The capital of the state containing Dallas is(the next token isAustin) - ❌ Bad:
The capital of the state containing Dallas is Austin.(there is nothing interesting to predict)
Other tips:
- Do not end with a space. Most tokens already start with a space (for example,
coffee, notcoffee). Neuronpedia shows a warning if your prompt ends with a space. - Check the next token. If it is a space, a markdown symbol, or an HTML tag, the graph will probably not be interesting. Neuronpedia shows a warning for these.
- Keep it short. The limit is 64 tokens (10 tokens for LORSA). Shorter prompts are faster and easier to read.
Advanced Settings
Click Advanced to change these values. Click Reset to go back to the defaults. The allowed ranges change for each model.
| Setting | Default | What it does |
|---|---|---|
| Custom Graph ID | (random) | The ID in your graph's URL. |
| Max # Logits | 10 | The maximum number of output tokens to show in the graph. |
| Desired Logit Probability | 0.95 | Show output tokens until their total probability is this value. |
| Max # Nodes | 5000 | The maximum number of feature nodes to include. More nodes take more time. |
| Node Threshold | 0.8 | Pruning. Keep the nodes that explain this fraction of the total influence. |
| Edge Threshold | 0.85 | Pruning. Keep the edges that explain this fraction of the total influence. |
| QK Top Fraction | 0.5 | LORSA only. The fraction of the most important LORSA heads to QK-trace. |
| QK Top K | 5 | LORSA only. For each traced head, the number of upstream nodes to keep. |
Your Graphs
You do not need an account to make a graph. But if you are not signed in, you must save the links to your graphs yourself. If you are signed in, your graphs are saved to your account. Anyone with the link can see a graph.
Generate with the API or on Your GPU
- API - See
POST /api/graph/generatein the API reference, or the generate_graph notebook. - Your GPU - Use the circuit-tracer library, then upload the graph.