Explore a Graph
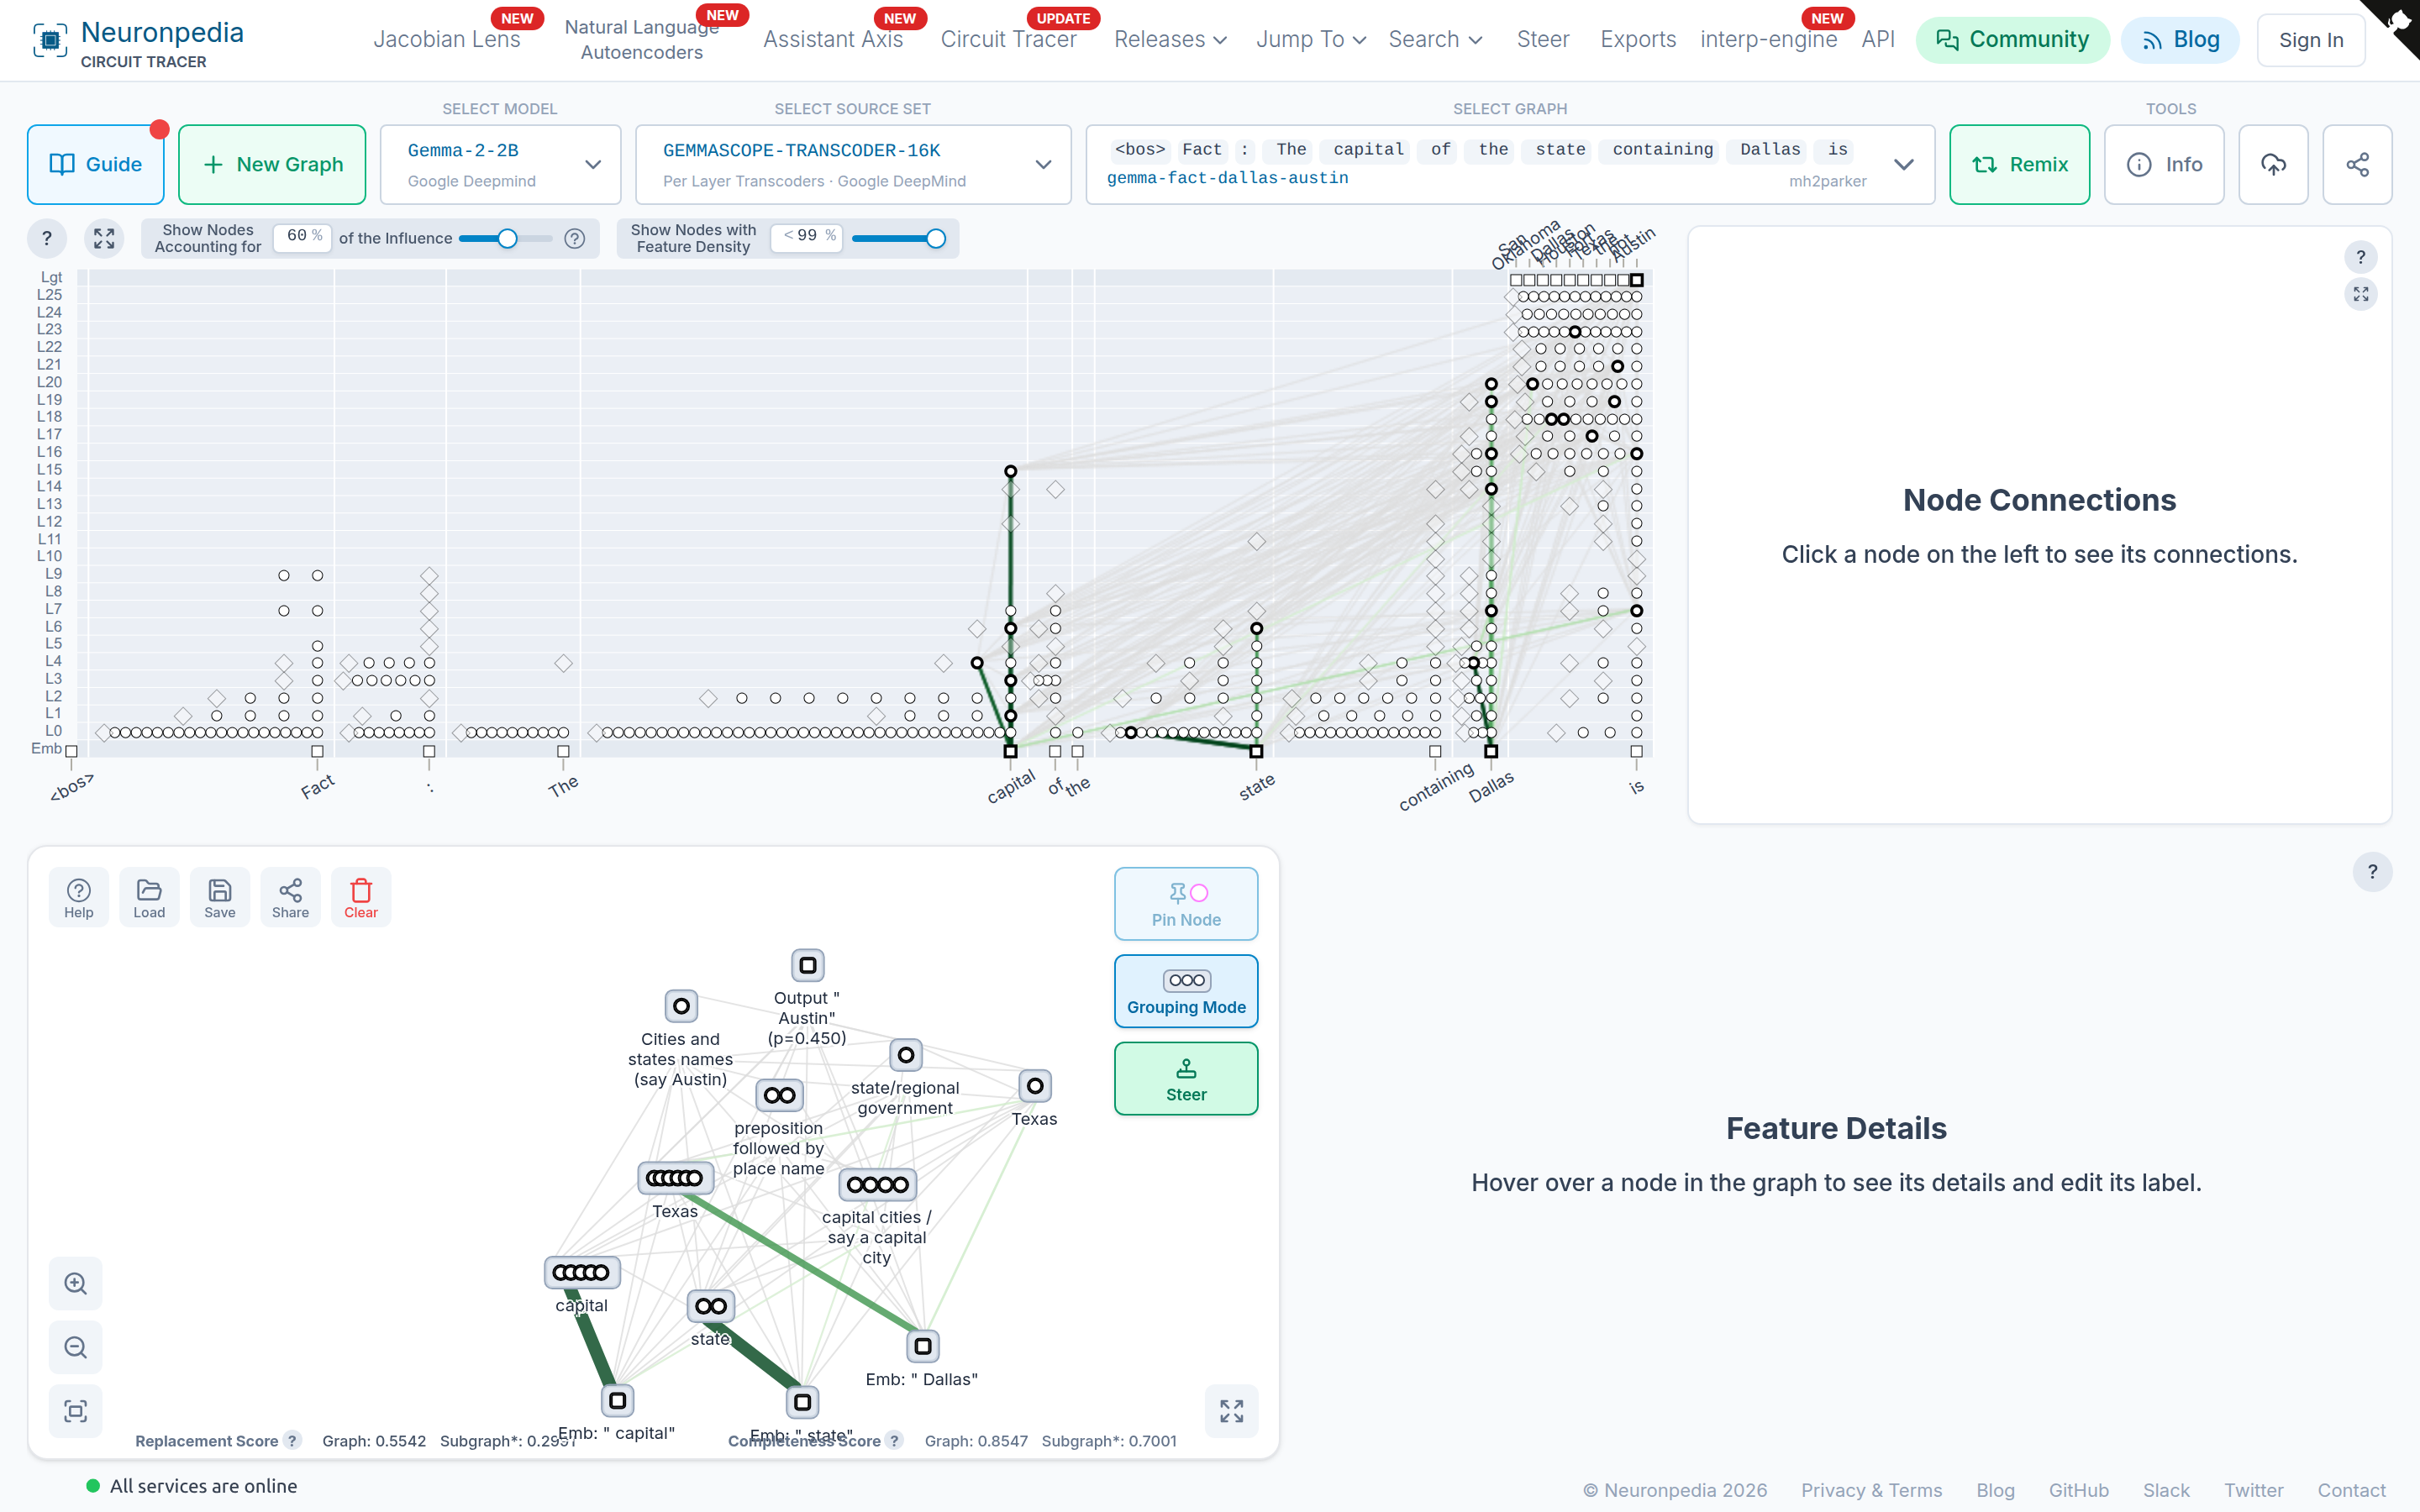
A graph page has four parts. We'll use the Dallas graph as the example.
Link Graph (Top Left)
The link graph shows every node that the graph kept after pruning.
- Columns are the prompt tokens, from left to right.
- Rows are the layers, from the embeddings (
Emb) at the bottom to the output logits (Lgt) at the top. - Circles are transcoder features. Squares are embeddings, logits, and error nodes. Triangles are attention (LORSA) features - see Attention in Graphs.
Hover over a node to see its feature. Click a node to select it and show its connections.
Two sliders at the top change what you see:
- Show Nodes Accounting for X% of the Influence - Prunes the graph. A lower value shows fewer, more important nodes.
- Show Nodes with Feature Density < X% - Hides features that activate on too many tokens.
For long prompts, click the expand button to make the graph scroll horizontally, so that the nodes have more space.
Node Connections (Top Right)
When you select a node, this panel shows the nodes that send input to it, and the nodes that it sends output to. The panel sorts them by the strength of the link.
Subgraph (Bottom Left)
The subgraph is where you make your hypothesis about the circuit. You add only the nodes that you think are important.
- Pin Node - Click a node in the link graph, then click Pin Node to add it to the subgraph.
- Grouping Mode - Click Grouping Mode, select two or more nodes, then click Save Group. A group of features is a supernode. In the example, the
Texassupernode holds six features that are all about Texas. - Label - Click the label under a supernode to give it your own name.
- Zoom and Pan - Use the buttons at the bottom left, or pinch, or click and drag.
- Save, Load, Share - Use the buttons at the top left of the subgraph.
At the bottom of the subgraph, Neuronpedia shows two scores for the graph and for your subgraph:
- Replacement Score - How much of the model's behavior the features explain, instead of the error nodes.
- Completeness Score - How much of the input to each node comes from features, instead of error nodes.
Feature Details (Bottom Right)
Hover over a node to see its feature dashboard, with top activations and logits. You can edit the feature's label here. Most features use a short auto-interp label that is made for graphs.
Share a Graph
The URL of a graph page holds the graph, your pinned nodes, your supernodes, your labels, and the slider values. To share your work, copy the URL, or click the share button at the top right.
Download a Graph
Click Info, then Download Graph JSON + Labels.